Dive into Valgrind

Eirian Perkins, Amber Womack, and Erik Eakins
CSCI 5828 - Presentation 3
Table of Contents
- Introduction and Motivation
- Background and Trivia
- What is Valgrind
- Production-Quality Tools Included
- When Where and Why Valgrind?
- Memcheck: The Default Tool
- Helgrind: A Thread Error Detector
- DRD: A Thread Error Detector
- Cachegrind: A Cache and Branch Prediction Profiler
- Interlude into the Cache
- Callgrind: a Call-Graph Generating Cache and Branch Prediction Profiler
- Massif: a Heap Profiler
- Conclusion
Introduction and Motivation
- Valgrind was originally developed to be a Linux memory debugging tool on the x86
- However, Valgrind has morphed into a generic framework for creating dynamic analysis tools[1]
- Valgrind includes 6 "production quality" tools; we will discuss each of these in turn
- Preview of topics:
- Memory error checker
- Thread error detectors
- Cache and branch prediction profilers (with/without graph generator)
- Heap profiler
Background and Trivia

- In Norse mythology, "Valgrind" is the entry gate to Valhalla
- "Valgrind" is pronounced "val-grinned"
- ...although "val-grind" is a good guess
Background and Trivia
- Valgrind's documentation is phenomenal
- We were hard-pressed to find any better sources
- Complete, clear, and filled with examples
- Based on experience with our previous presentations, this is a big deal.
- Check out their webpage!
Background and Trivia
- Developers from all over the world collaborate on Valgrind
- The list of developers may be found here
- Want to join? make a request here
- Valgrind works on Linux, Solaris, Android, and OS X
Production-Quality Tools included
- We will be discussing the following:
- Memcheck, a memory error checker
- this runs by default if you do not specify a tool
- Helgrind and DRD, two thread error detectors
- Callgrind -- cache/branch prediction profiler that generates call graphs
- Cachegrind -- a cache and branch prediction profiler
- Valgrind simulates the cache. If it does not have a cache profile, you can adjust the settings
- Massif, a heap profiler
What is Valgrind?
- Valgrind is essentially a "just in time" compiler on a virtual machine
- Valgrind simulates the CPU and cache, for example
- ...and can inject code to determine memory leaks (more on this later)
- An "intermediate representation" (IR) will be generated from the original program [1]
- The IR is SSA-based and processor neutral
- The running Valgrind tool will do some transformation on the IR and convert it back to machine code
- This is why code runs 10-50x slower through Valgrind
- The null tool simply converts code to IR and back again
When Where and Why Valgrind?
- Detecting Errors Early: A business case[3, 4]
- Avoid damage to the company's reputation
- Boost product sales
- Customer and consumer confidence
- Catching errors late in the development cycle (or after release) has a "cascading impact" on time and money spent
- A fix can be orders of magnitude more expensive if caught late
- Don't drive business to your competitors!!!
When Where and Why Valgrind?
- Valgrind is everywhere
- Office Software -- OpenOffice
- Web Browsers -- Mozilla
- Databases -- MySQL
- Scientific -- R
- Graphics -- RenderMan, GIMP, and Blender
- Programming language implementations -- Python, LLVM compiler
- Libraries -- Boost
- Games -- Unreal Tournament
- See the complete list here
When Where and Why Valgrind?
- Awards
- January 2004: Winner of a bronze Open Source Award
- July 2006: Julian Seward awarded with the Google-O'Reilly "Best Toolmaker" Open Source Award for his contributions to Valgrind
- May 2008: Winner of the TrollTech Qt Open Source Development Award for the best open source development tool
Memcheck -- The Default Tool
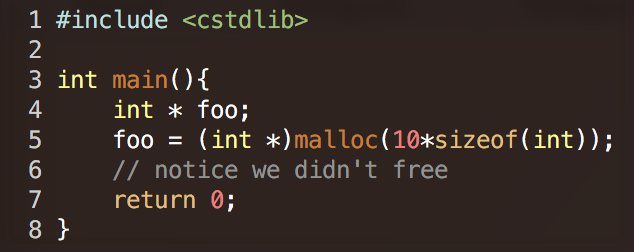
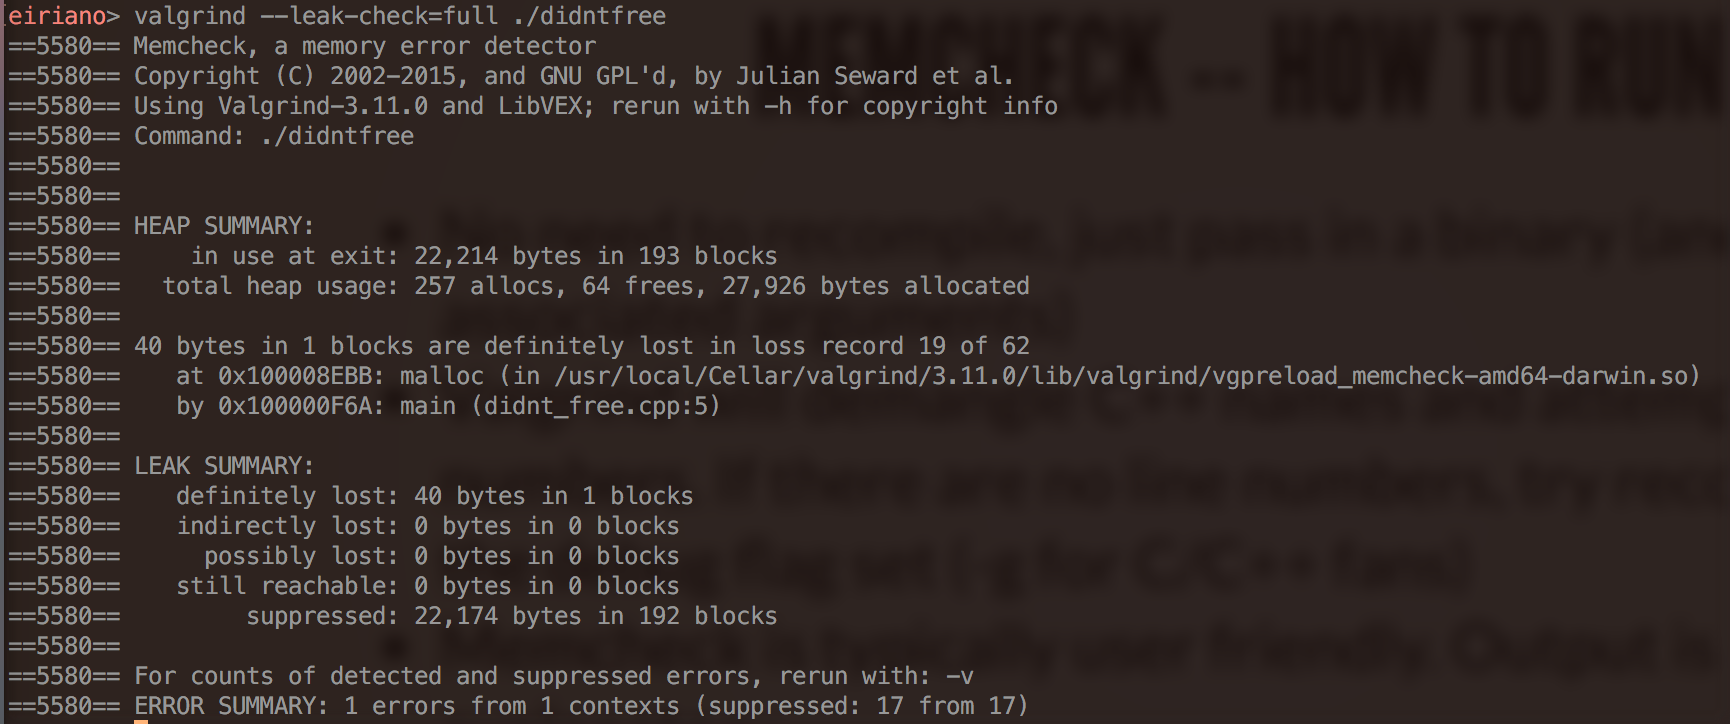
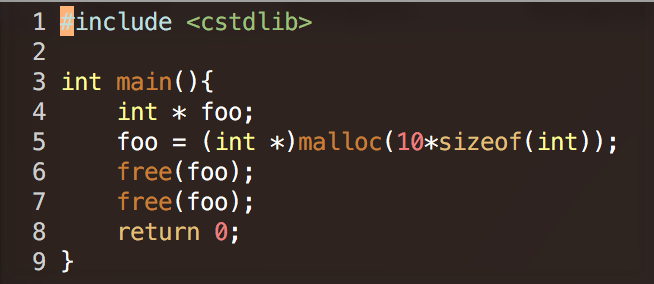
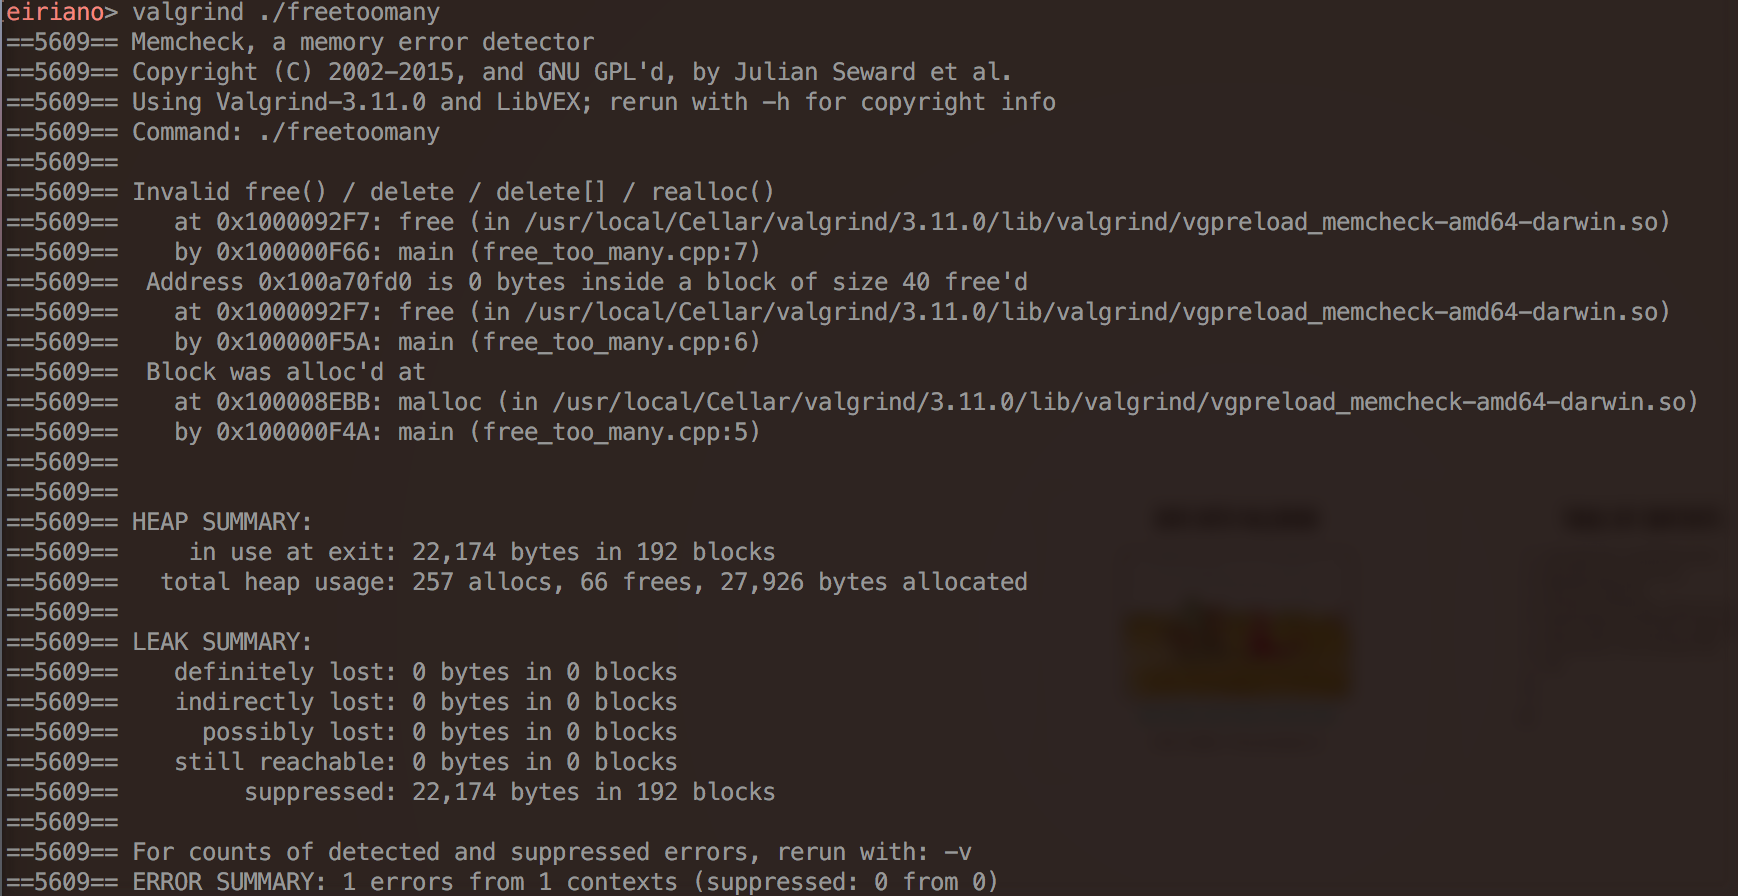
- Memcheck is a "memory error detector"
- accessing freed memory
- overruning heap blocks, top of stack
- usining uninitialized values
- incorrect heap memory freeing
- memory leaks
- When I think Valgrind, I think Memcheck
- If no tool is specified, memcheck is selected
Memcheck -- The Default Tool
- How to run memcheck?
- Helpful options:
- Tracking children and more:
$ valgrind [valgrind-options] <your prog here> [prog options]
		or
$ valgrind --tool=memcheck [valgrind-options] <your prog here> [prog options]
--track-origins=yes		# track origins of uninitialized values; will not do this by default
--leak-check=yes		# Enables detailed leak detector. Recommendation: run first without this option,
				# it can be verbose. leak-check can be set to any of {no, summary, yes, full}
-v # Verbose. Get more information. --trace-children=yes # follow child processes (for example, exec* family of functions)
--child-silent-after-fork=yes # suppress output from a forked process
--tracking fds=yes # track open file descriptors
Memcheck -- How to run
- No need to recompile, just pass in a binary (and any associated arguments)
- Valgrind will demangle C++ names and attempt to give line numbers. If there are no line numbers, try recompiling with the debug flag set (-g for C/C++ fans)
- Memcheck is typically user friendly. Output is fairly self-explanatory
- Memcheck gives suggestions at the end of its output
Memcheck -- Quick examples
Memcheck -- Quick examples
Memcheck -- Quick examples
Memcheck -- Quick examples
Memcheck -- Quick examples
Memcheck -- Quick examples
Memcheck -- Quick examples
Memcheck -- Quick examples
Memcheck -- Decoding error messages
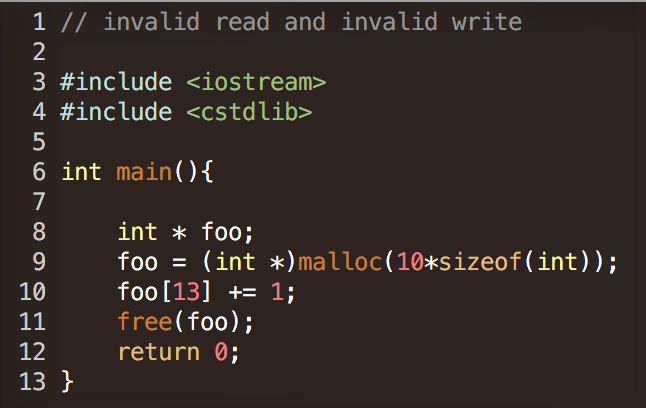
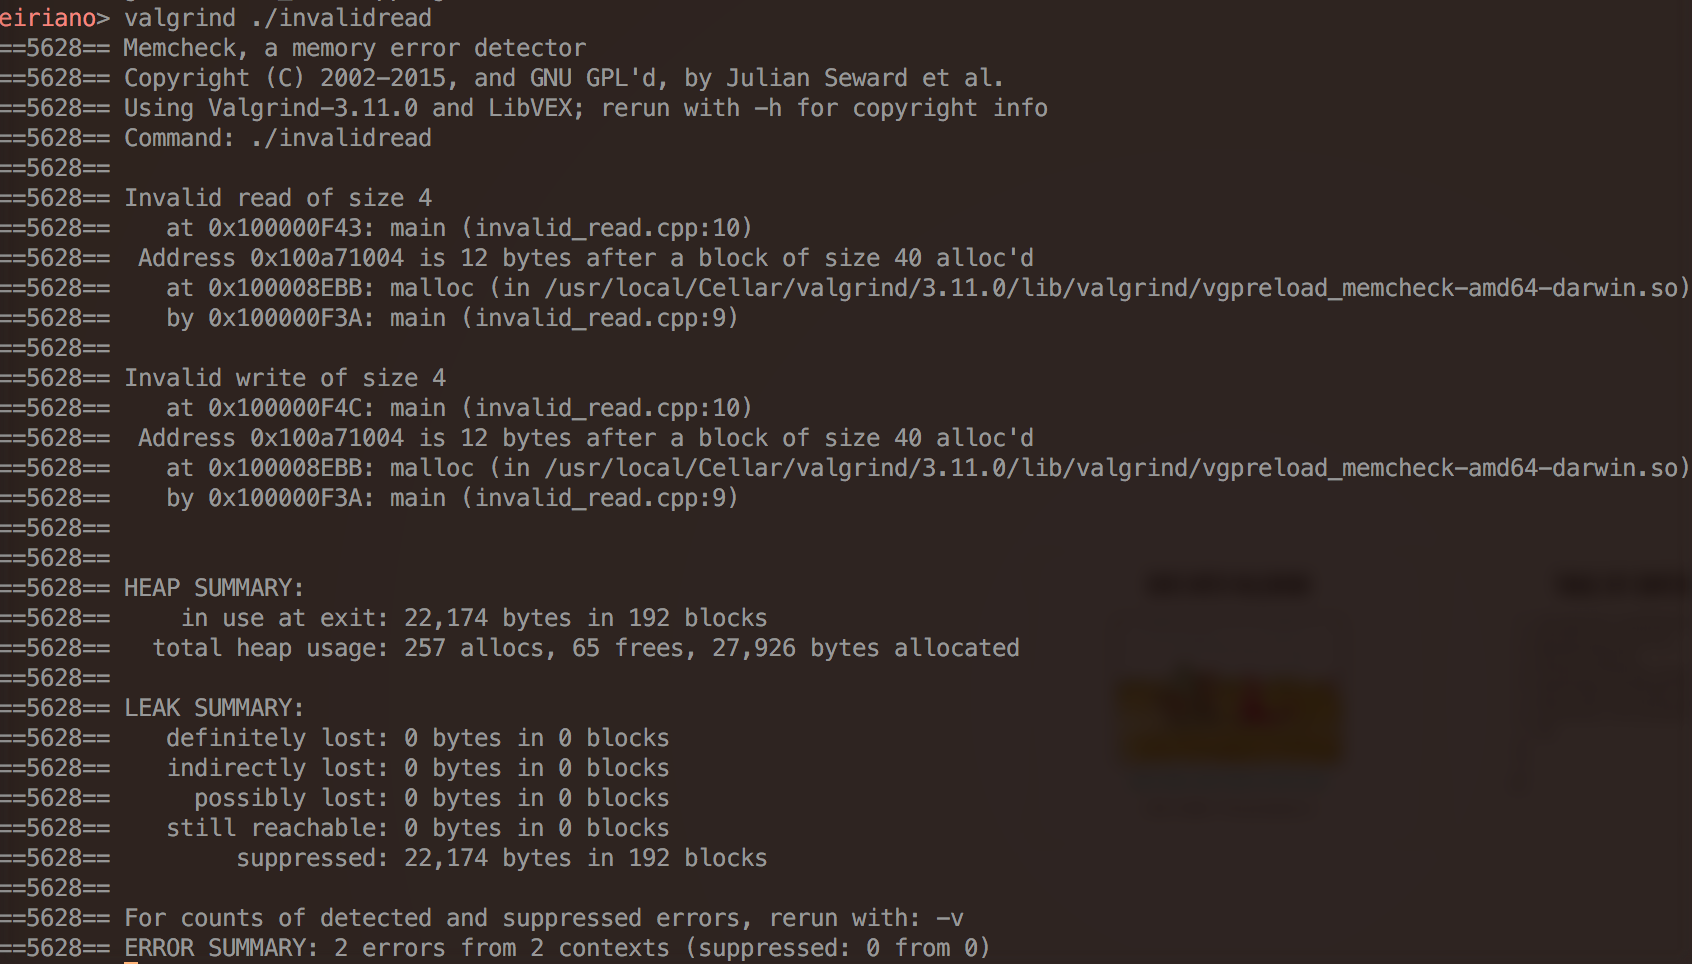
- "Invalid read of size x"
- illegal read from invalid stack address or invalid heap block
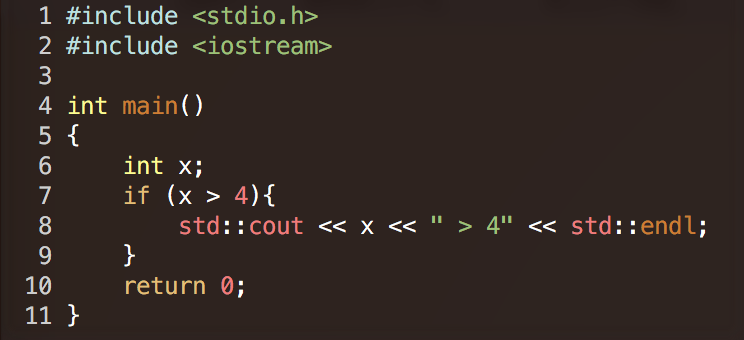
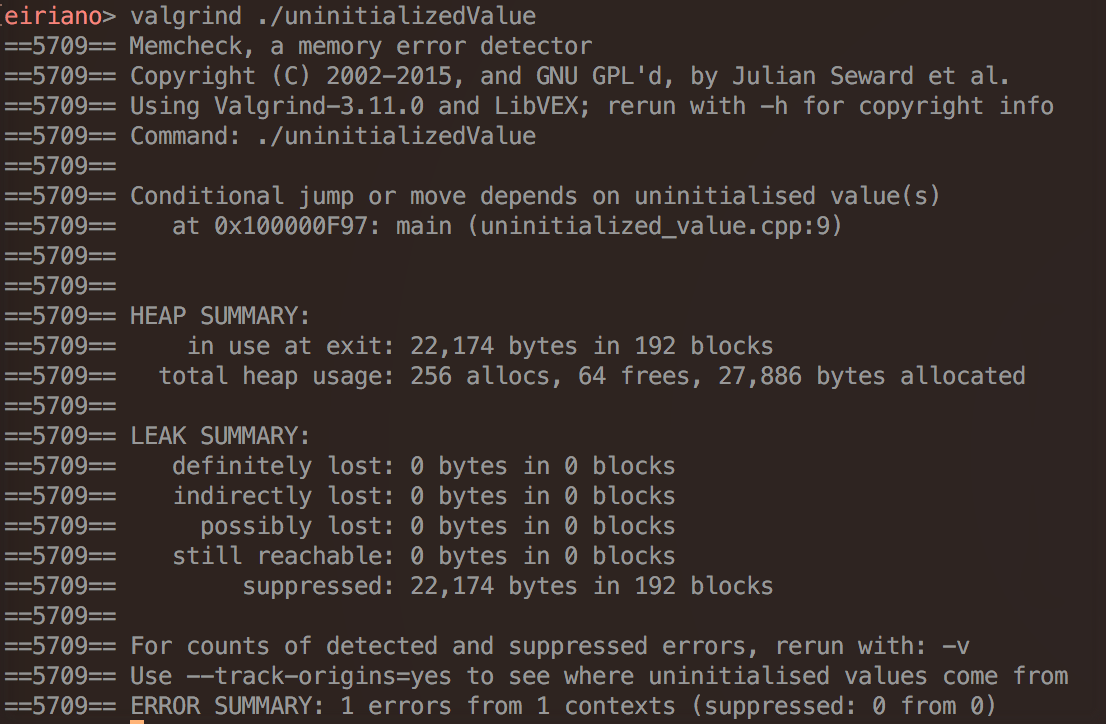
- "Conditional jump or move depends on uninitialised value(s)"
- you tested against an uninitialized value
- "Invalid free()"
- illegal free, maybe you freed the same block twice
Memcheck -- Decoding error messages
- "Mismatched free() / delete / delete []"
- you mixed "new" with "free" or "malloc" with "delete." This is wrong.
- the difference: "new" and "delete" call constructor and destructor, respectively. It will probably work on Linux, but it won't be portable. We were not able to repro this on OS X, maybe clang++ is too smart for us
- "Source and destination overlap in memcpy(0xbffff294, 0xbffff280, 21)"
- memory overlap, perhaps when copy from src to dst (src and dst point to some same memory between them). This behavior is undefined
Memcheck -- Known issues
- "My program uses the C++ STL and string classes. Valgrind reports 'still reachable' memory leaks involving these classes at the exit of the program, but there should be none."
- probably an implementation of C++ std lib is uses its own memory pool allocator. Don't worry about this.
- Valgrind crashes
- it's possible bad code you are testing overwrote valgrind's memory checker
- your program could have jumped to a non-code address, or valgrind doesn't handle that CPU instruction. If this is the case, file a bug report.
Helgrind: A Thread Error Detector
- Helps discover and resolve race conditions, inconsistent lock ordering, misuse of POSIX threads, and more
- Use
- Intended for C, C++, and Fortran
$ valgrind --tool=helgrind
Helgrind: Effective Use Stragegy
- Write threaded programs from the beginning that allow Helgrind to verify its correctness
- Use a Linux distribution
- Use POSIX threading primitives
- Avoid memory recycling and POSIX condition variables
- Use pthread_join on finishing threads
- performing Helgrind, which is thread debugging, and Memcheck, which is memory debugging at the same time
Helgrind: Example
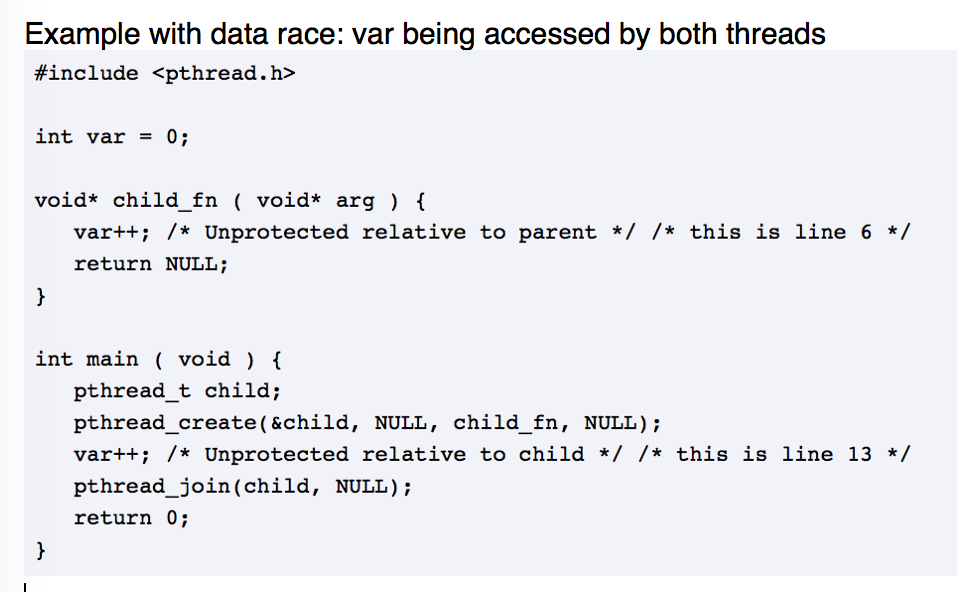
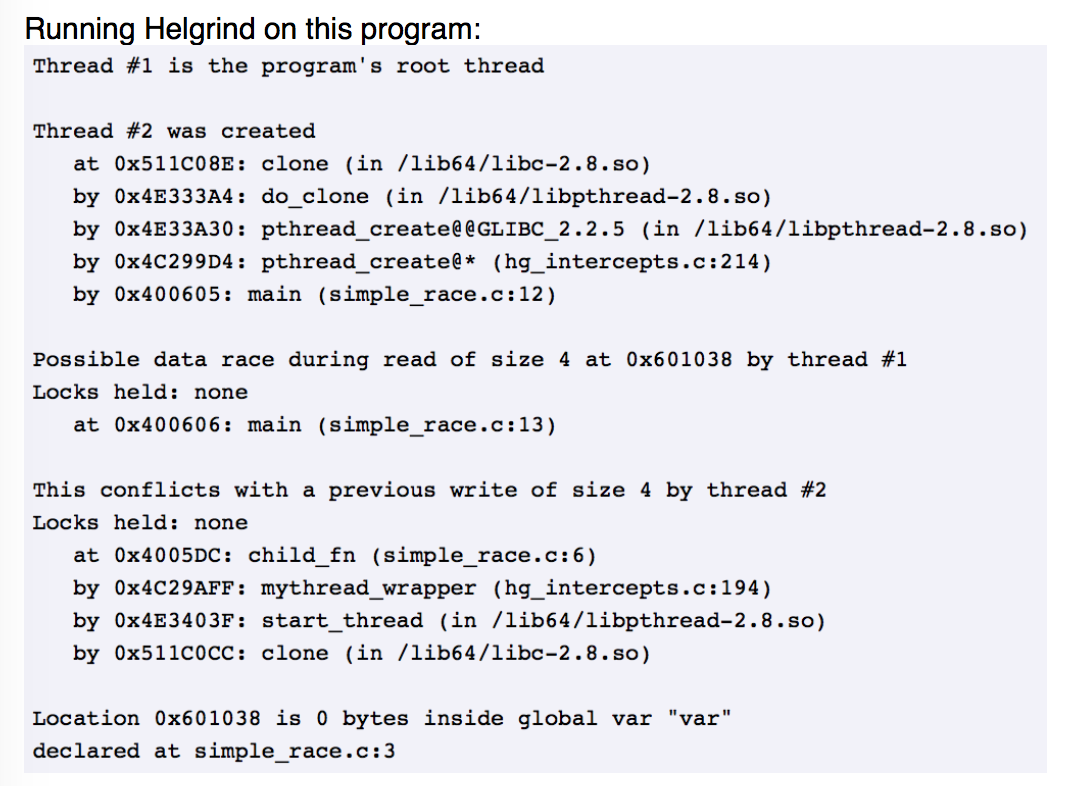
- Let's consider a race condition
- May occurr when there are multiple threads running at the same time that try to access shared memory
- Due to the thread scheduling algorithm, its difficult to know which thread will attempt to access the shared region, since the threads can swap at any time
- For these cases, locking or synchronizing can help prevent these issues
- Let's take a look...
Helgrind: Example
Helgrind: Example
Helgrind: Wrap-up
--ignore-thread-creation= [default: no]
- This will allow control for whether all activities during the thread creation should be ignored or not.
--check-stack-refs=no|yes [default: yes]
- Since Helgrind checks all data memory accesses your program makes, this flag allows you to skip the check for accesses to the thread stack.
Helgrind: Wrap-up
--free-is-write=no|yes [default: no]
- If this is enabled, Helgrind will treat the freeing of heap memory the same as if the memory was written immediately before the free.
--track-lockorders=no|yes [default: yes]
- If this is enabled, Helgrind will perform lock order consistency checking.
DRD: A Thread Error Detector
-
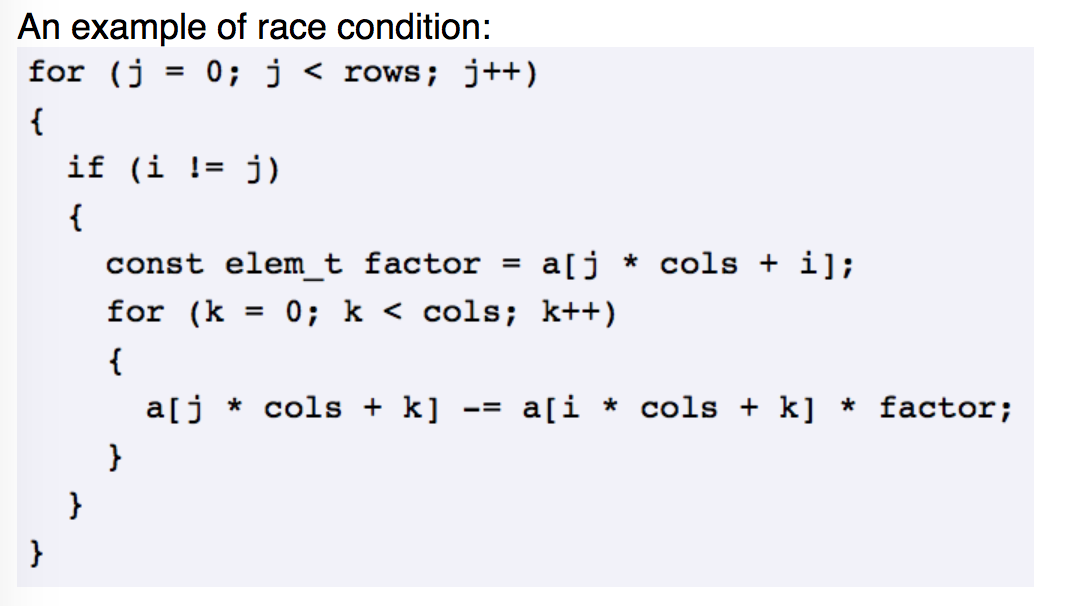
DRD is another valgrind tool used to for detecting errors. This one focuses on the errors within multithreaded programs for C/C++ that uses POSIX threading primitives. It is helpful for Data races, lock contention, improper use of POSIX threads API, deadlocks, and false sharing. It will print a message when it finds one of these errors.
DRD -- Effective use
- debug information needs to be present in the executable
- to reduce the amount of generated code, compile with –O1 option
- install the debug packages for the linux distribution libraries
- Do not send output from more than one thread to std::cout
DRD: Example
DRD: Example

DRD: Wrap-up
--show-stack-usage= [default: no]
- This will print the known stack usage at the exit time of the thread.
--show-confl-seg= [default: yes]
- This will show the conflicting segments contained in the race reports.
DRD: Wrap-up
--shared-threshold= [default: off]
- It also can print an error message if a reader lock is held longer than the allotted time.
--check-stack-var= [default: no]
- Helps controls if DRD detected data races on stack variables..
Cachegrind: A Cache and Branch Prediction Profiler
- Cachegrind is a cache-miss profiler
- Unlike the previous tools we have seen, compiler optimisation should be enabled, and compiling should be done with the -g flag
- Why turn on optimisation? We want data on cache misses that resemble reality
- Like memcheck, that simulated the CPU, Cachegrind simulates the cache
Cachegrind: A Cache and Branch Prediction Profiler
- The first and last level caches are simulated. Why not more? The last level cache has the most impact on runtime performance, while simulating the first level can detect cases where code interacts badly with the cache
- The Cachegrind tool will automatically detect cache settings and run based on a pre-specificied configuration which is based on the CPUID. If no configuration can be found, the user must specify reasonable values.
Interlude into the Cache
- Modern CPUs have different levels in the cache
- an L1 (level 1) cache is checked first and is the fastest
- an L2 cache is checked next and is the next fastest cached
- an L1 miss costs ~10 CPU cycles, an L2 miss costs up to 200 cycles
- a mis-predicted branch can cost between 10-30 cycles.
- after checking the cache, look in external memory
- "LL" means last level, or the slowest cache.
Cachegrind -- Terminology
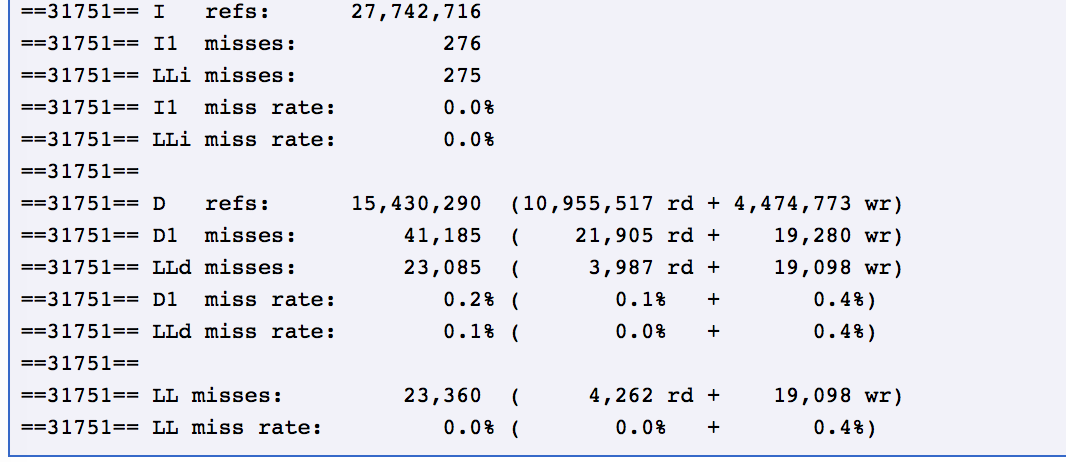
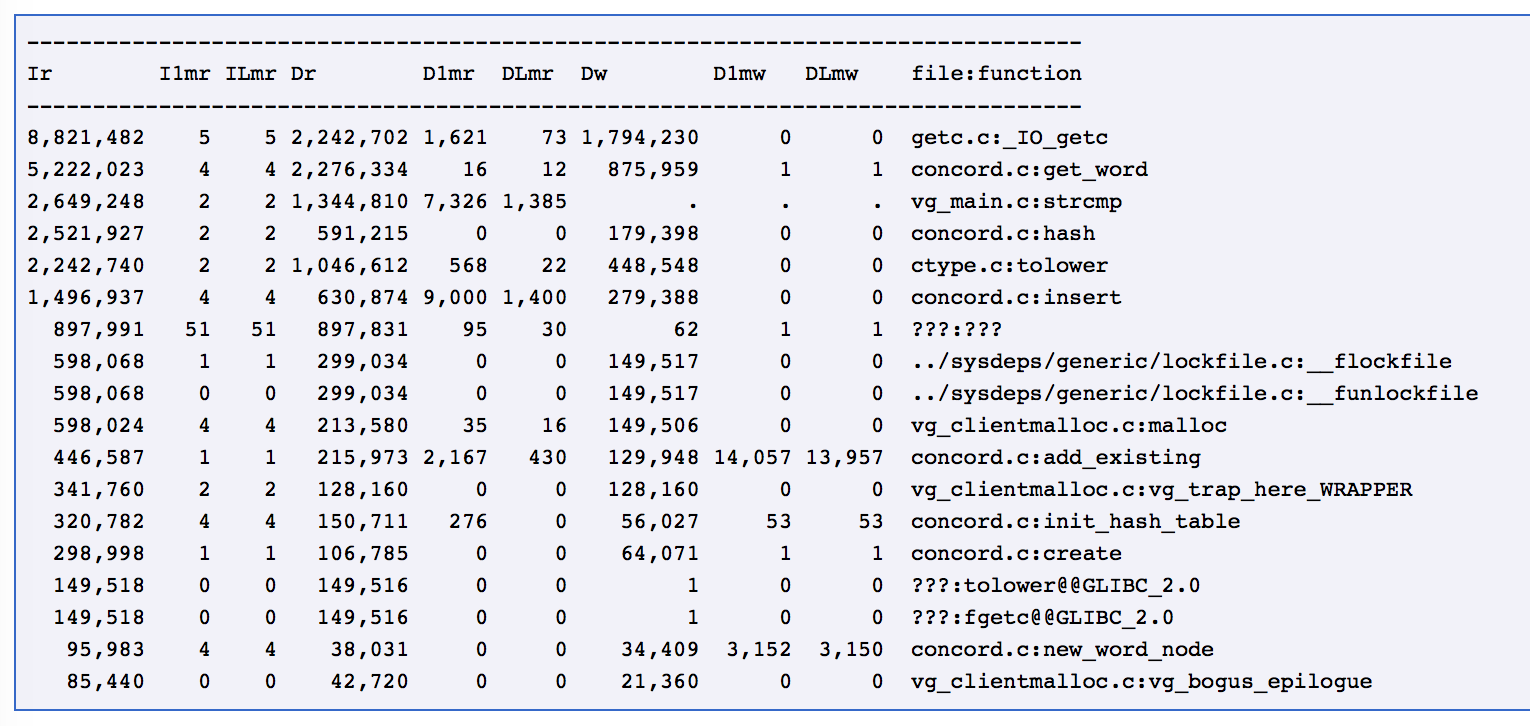
- "Ir" -- I cache reads, the number of instructions executed
- "I1mr" -- I1 cache read misses
- "ILmr" -- LL cache instruction read misses
- "Dr" -- D cache reads, the total number of memory reads
- "D1mr" -- D1 cache read misses
- "DLmr" -- LL cache data read misses
- "Dw" -- D cache writes, the number of memory writes
- "D1mw" -- D1 cache write misses
- "DLmw" -- LL cache data write misses
- "Bc" -- Conditional branches executed
- "Bcm" -- conditional branches mispredicted
- "Bi" -- Indirect branches executed
- "Bim" -- indirect branches mispredicted
Cachegrind
- "Note that D1 total accesses is given by D1mr + D1mw, and that LL total accesses is given by ILmr + DLmr + DLmw."
- These statistics (see previous slide) will be shown for the entire program and for each function in the program. This behavior may be changed, see the manual for details
- What if a reference "straddles" two cache lines?
- both hit -> counts as one hit
- one hit, one miss -> counts as one miss
- "Instructions that modify a memory location" count as a single read operation. Why? Writes never miss
- Branch prediction may be enabled with a command line argument
Cachegrind -- Running Cachegrind
valgrind --tool=cachegrind prog
- This generages a file,
cachegrind.out.<pid>each time the program is run - Appending the PID will probably avoid clobbering the file if Cachegrind is run again in the same directory
- Appending the PID also enables data to be collected on children processes, which will also generate a new file
Cachegrind -- Running Cachegrind
- The generated files are human readable, but it's easier to interpret them using cg_annotate.
- you can use cg_merge to combine runs or cg_diff to find differences between runs
- cg_foo are tools provided by Valgrind
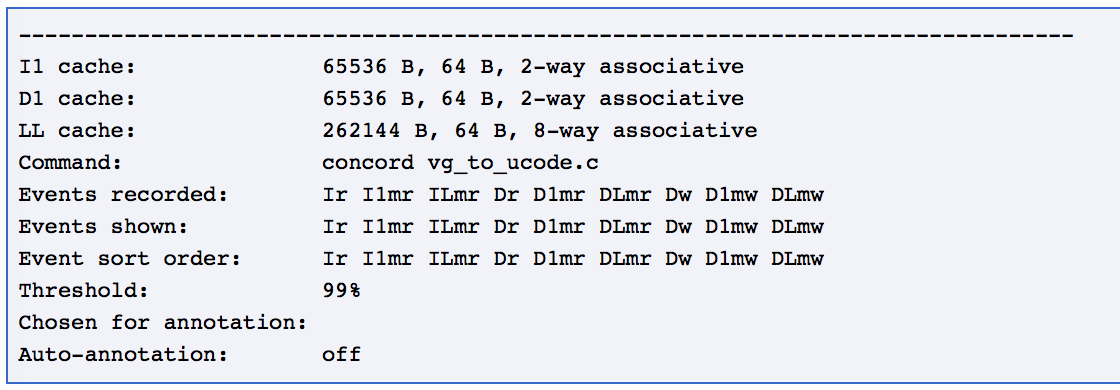
eiriano> cg_annotate cachegrind.out.8561
Cachegrind -- Example
- Let's consider Cachegrind's output only. Reading the output is the hardest part.
- Using Cachegrind and Callgrind require a working knowledge of the CPU and cache
- a primer is available here
- Let's look at some output....
Cachegrind -- Example
Output from runningvalgrind --tool=cachegrind prog
Cachegrind -- Example
-
Output from running
cg_annotate cachegrind.out.pid
Cachegrind -- Example
-
Output from running
cg_annotate cachegrind.out.pid

Cachegrind -- Example
-
Output from running
cg_annotate cachegrind.out.pid
Cachegrind -- Wrap-up
- The previous tools we have seen give helpful hints and tips after running
- Cachegrind is different. In order to use cachegrind, you must know how to use Cachegrind
- But, the instructions thus far can give you some intuition on where your program is slowing down
Callgrind -- Cachegrind++
- Callgrind is a profiling tool that records the call history among functions in a program's run as a call-graph. By default, the collected data consists of the number of instructions executed, their relationship to source lines, the caller/callee relationship between functions, and the numbers of such calls. Optionally, cache simulation and/or branch prediction (similar to cachegrind) can produce further information about the runtime behavior of an application.
Callgrind -- Cachegrind++
- The profile data is written out to a file at program termination. For presentation of the data, and interactive control of the profiling, two command line tools are provided:
- callgrind_annotate
- callgrind_control
Callgrind -- Cachegrind++
- callgrind_annotate
- reads in the profile data, and prints a sorted lists of functions, optionally with source annotation. For graphical visualization of the data, try kcachegrind, which is a KDE/Qt based GUI that makes it easy to navigate the large amount of data that callgrind produces
- callgrind_control
- enables you to interactively observe and control the status of a program currently running under callgrind's control, without stopping the program. You can get statistics information as well as the current stack trace, and you can request zeroing of counters or dumping of profile data.
Callgrind -- Cachegrind++
- Callgrind extends the cachegrind functionality by propagating costs across function call boundaries. If function foo calls bar, the costs from bar are added into foo's costs. When applied to the program as a whole, this builds up a picture of so called inclusive costs, that is, where the cost of each function includes the costs of all functions it called, directly or indirectly.
Callgrind -- Cachegrind++
- Options that can be run with each tool
- Should compile with -g flag for debugging purposes
- This prints the backtrace:
callgrind_control -b
- This prints the backtrace with event counts:
callgrind_control -e -b
- After terminiation, a profile datafile will be generated callgrind.out.
- To generate a function by function summary from the profile data file, use:
callgrind_annotate [options] callgrind.out.<pid>
valgrind --tool=callgrind [callgrind options] your-program [program options]
Massif -- The Heap Profiler
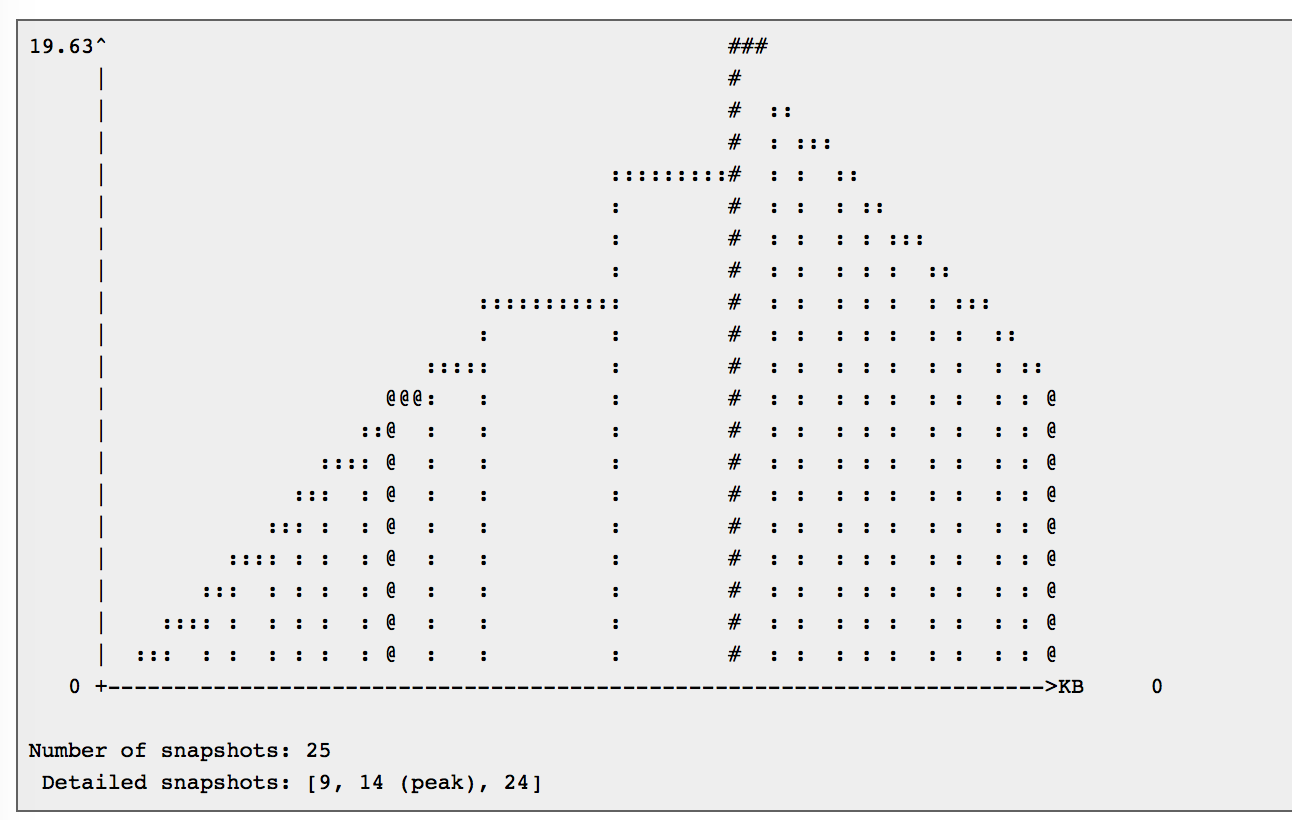
- Massif is a heap profiler. It performs detailed heap profiling by taking refular snapshots of a program's heap. It produces a graph showing heap usage over time, including information about which parts of the program are responsible for the most memory allocations. The graph is supplemented by a text or HTML file that includes more information for determing where the most memory is being allocated. Massif runs programs about 20x slower than normal
Massif -- The Heap Profiler
- On modern machines with virtual memory, Massif can speed up the program -- interact better with machine's caches and avoid paging, it will help reduece the chance that it exhausts your machine's swap space. Massif c an identify leaks that aren't actually lost, pointers remain to it, but they are no longer in use. Traditional memcheck's may not find these leaks, but Massif can.
- When compiling, must use the -g flag. To run:
valgrind --tool=massif
ms_print <filename>
Massif -- The Heap Profiler
- Use the --time-unit=B option to specity that we want the time unit to instead be the number of bytes allocated/deallocated on the heap and stack(s).
- Maximum number of snapshots is 100, although, can change this using --max-snapshots
- --detailed-freq option changes how often a detail snapshot is taken (default is everything 10th.)
Massif -- Known issues
- Massif's determination of when the peak occured can be wrong, for two reasons, Peak snapshots are only ever taken after a deallocation happens. This avoids lots of unnecessary peak snapshot recordings (imagine what happens if your program allocates a lot of heap blocks in succession, hitting a new peak every time). But it means that if your program never deallocates any blocks, no peak will be recorded. It also means that if your program does deallocate blocks but later allocates to a higher peak without subsequently deallocating, the reported peak will be too low.
- Even with this behavior, recording the peak accureately is slow. So by default Massif records a peak whose size is within 1% of the size of the true peak. This unaacuracy in the peak measurement can be changed with the --peak-inaccuracy option.
- If the program forks, the child will inherit all the profiling data that has been gathered for the parent. If the output file format string does not contain %p, then the outputs from the parent and child will be intermingled in a single output file, which will almost certainly make it unreadable by ms_print
Massif -- Example
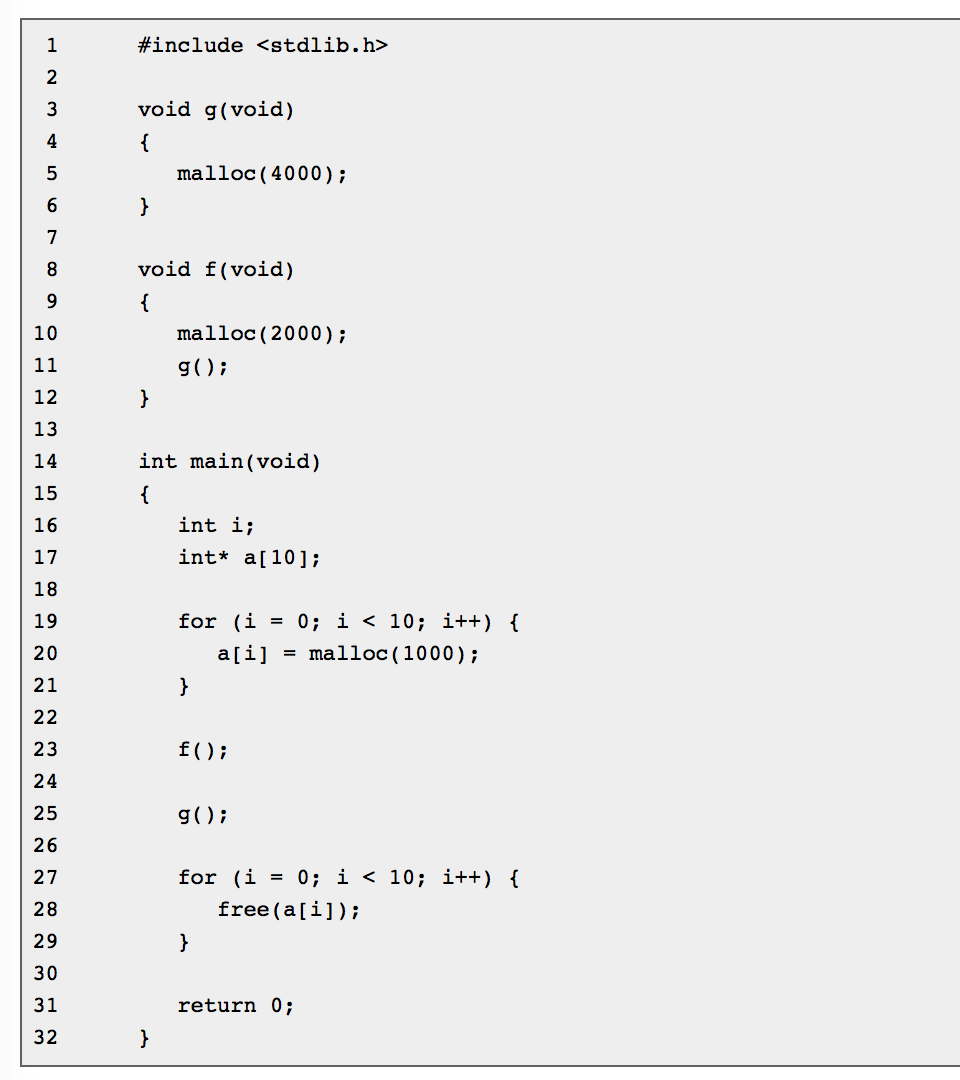
Massif -- Example
-
Generate a massif.out file

...And run ms_print

Massif also has a typical preamble:

Massif -- Example
Well, that's not too interesting. What happened? Our program is tiny and has a very short run time.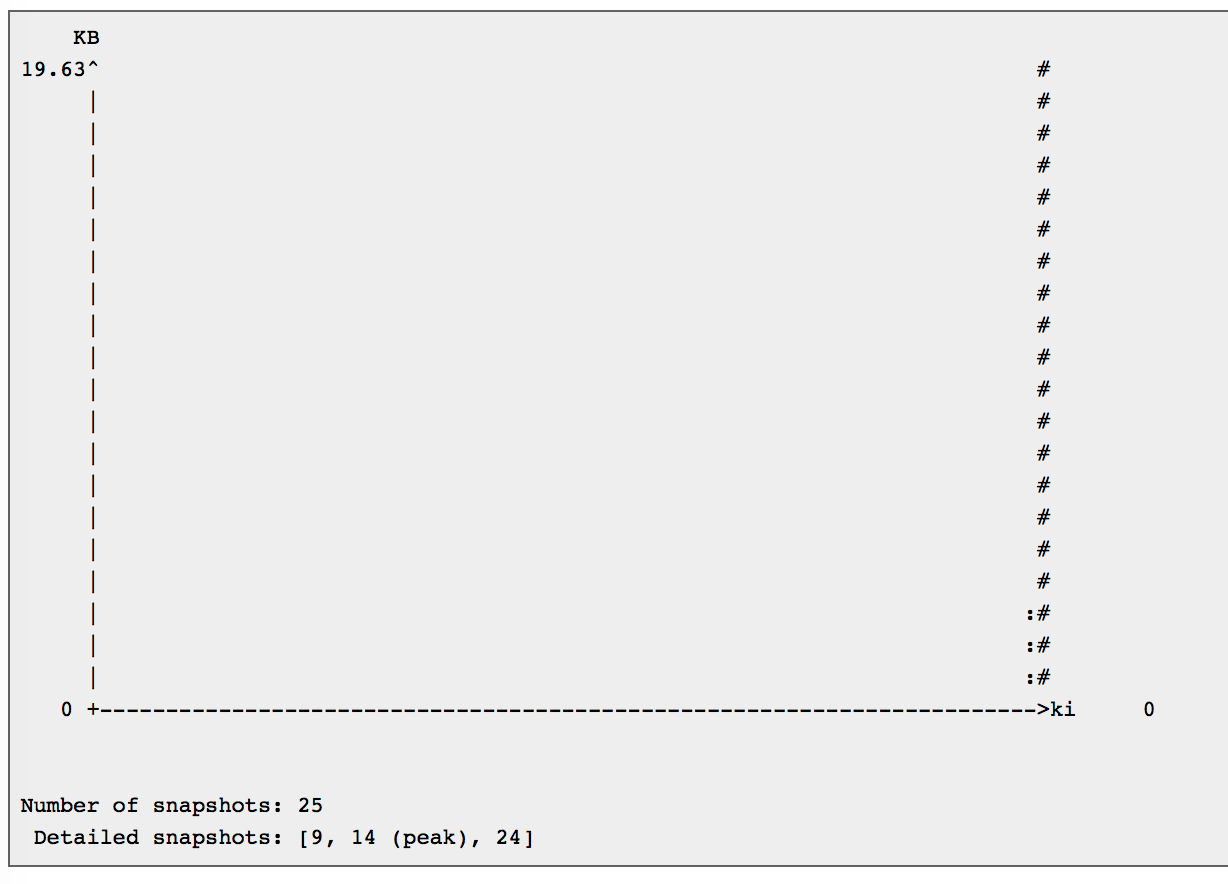
Massif -- Example
To get more interesting output, let's use the --time-unit=B option. Repeat the steps above, starting with running valgrind --tool=massif --time-unit=B ./myGreatProg
Conclusion
- Valgrind is much more than a leak checking tool. Change your perspective: Valgrind is an undefined behavior killer.
- Valgrind should be your tool of *first* resort. It not only tells you where your bugs are happening, but why, and it'll tell you this even if your program doesn't crash (unlike GDB on both counts). For what it's worth, GDB is still a very useful tool for getting full stack traces on failed assertions and for debugging concurrent code, among other things.
Conclusion
- You may also find it useful to always compile with -g -pedantic -Wall -Wextra. Your compiler is often smart enough to flag undefined behavior as well. What the compiler misses, Valgrind should catch.
- Valgrind is a great tool for handling accidental difficulties when optimizating code for speed and memory. Accidental difficulties are difficulties that develop during the production process, and valgrind is a tool meant to be used during code production to identify bugs, memory leaks, call costs, etc, which can be fixed for a much more optimized program.
Conclusion
- What are you waiting for? Check out Valgrind now!
References
-
[1] https://en.wikipedia.org/wiki/Valgrind
[2] http://valgrind.org
[3] JM Stecklein. Error Cost Escalation Through the Project Life Cycle. June 2004. http://ntrs.nasa.gov/archive/nasa/casi.ntrs.nasa.gov/20100036670.pdf NASA Johnson Space Center.
[4] Team Professor. Fundamentals of Secure Development. Accessed October 2015. https://teamprofessor.absorbtraining.com/
[5] https://en.wikipedia.org/wiki/CPU_cache#Multi-level_caches
11/15/2015 update: Slide 8 taken from Eirian's presentation 2